Statistical Process Control Methods for Reagent Lot Release
Statistical process control separates natural reagent drift from shifts requiring corrective action.

A cell-free protein synthesis reaction runs on 30 to 40 interdependent components, and each one carries its own tolerance for how far it can drift before the reaction changes. Statistical process control gives labs a way to tell which drifts matter and which don't, turning reagent lot release from a guess into a defensible decision. That is the argument this piece makes, and the rest of it builds the case component by component.
Why CFPS reagents are hard to keep consistent batch to batch
Cell-free protein synthesis runs transcription and translation outside a living cell, using frozen or lyophilized extract, an energy-regeneration mix, and a DNA template to produce protein within hours. A typical reaction draws on roughly 30 to 40 components beyond the extract itself: amino acids, nucleotides, energy substrates, cofactors, salts, and polymeric additives like polyethylene glycol, each added to supply the raw materials and energy the lysate needs to build protein. The tolerance on any single one of those components might be narrow, but tolerances compound across 30 to 40 of them, and a reaction that looks fine on paper component by component can still drift as a system.
The intuitive assumption is that the extract, the biological and least standardized part of the mix, is where most of that drift comes from. The extract preparations accounted for none of that variability. The chemical reagent mix, not the biological extract, turned out to be the dominant source of inconsistency, and that result reverses the usual target of quality concern in CFPS work. It also happens to point toward the one part of the system best suited to the kind of monitoring this piece is about: chemical components can be measured directly, repeatedly, and cheaply, in a way a biological extract generally cannot.
The danger in this kind of variability is that it rarely announces itself. The scientist using that lot weeks later sees only a yield that quietly fell short, with no obvious cause and no record connecting it back to the lot. That gap between what a release test checks on day one and what the lot actually does over its working life is the problem the rest of this piece addresses.
How Uncontrolled Reagent Variability Corrupts Experimental Conclusions
Lower yield is the least costly failure mode here. The more serious consequence is that reagent variability travels into the data itself, shaping which conclusions an experiment appears to support. A coefficient of variation of 40.3% across sites is large enough to flip how two experiments compare: a protein variant that looks like the better performer in one lab's hands can look worse in another's, because the reagent lots underneath the two experiments differ, not because the biology differs. Reproducibility in that setting depends less on the experimental design than on whether the reagents behind two runs came from the same, well-characterized source.
Plate format adds a second axis of error that compounds with the first. Running a 384-well plate screen with reagent lots that also vary by 40% stacks the two error sources on top of each other: a variant's apparent performance now reflects some unknown mixture of its real biology, the plate format it happened to sit in, and the particular reagent lot it was tested against.
This matters most acutely in high-throughput variant screening, where a lab might test hundreds of candidate proteins across multiple plates prepared from multiple reagent lots over the course of a campaign. Variability of this kind does not stay contained inside a single failed reaction. It moves into the conclusions a lab draws from its data, and no amount of careful experimental design downstream can correct for an unmeasured shift in the reagents upstream.
SPC's core logic and its fit for reagent lot release
Statistical process control exists to answer one question about a measurement over time: did this change because the process naturally varies, or because something about the process actually shifted? That distinction, between what statisticians call common-cause and special-cause variation, decides whether a result calls for action or not. SPC's job is to make that distinction visible and routine rather than a matter of judgment call after judgment call.
Control charts are the primary tool here: a sequence of measurements, usually one per lot or one per batch, plotted against limits calculated from the process's own historical data rather than from the specification the process is supposed to meet. That distinction between control limits and specification limits is not a technicality. Regulatory inspections have documented cases where the two were conflated, with specification limits used as if they were control limits, which defeats the purpose of the chart: a process can be perfectly in control statistically while still drifting toward an out-of-specification result, and a chart built on the wrong kind of limit will miss that drift until it is too late to correct.
Two patterns on a control chart matter most for CFPS reagent lots. Reading which pattern is present tells an investigator where to look before a single additional test is run.
Control charts and capability indices do different jobs and need to be read together. A control chart answers a retrospective question: has this process changed? A capability index like Cpk or Ppk answers a prospective one: given how this process actually behaves, can it reliably produce results inside the specification it has to meet? Pharmaceutical SPC practice sets a minimum Cpk of 1.33 for an established process, with higher targets reserved for critical quality attributes. That number translates into a concrete design question for any CFPS reagent program: how tight does a yield or activity window have to be set, relative to how much natural scatter the process actually produces, before a Cpk of 1.33 or better is achievable?
Decomposing CFPS lot variance into the components SPC can and cannot see
Before any control chart is useful, the variance it's charting has to be understood for what it actually contains. A measurement of lot-to-lot variability is never pure: it's always a mixture of real differences between lots and noise introduced by the assay used to measure them, and those two sources have to be separated before a control limit means anything. Standard pharmaceutical practice handles this by combining lot-to-lot variance and method variance in quadrature when estimating the standard deviation used for tolerance interval calculations, a formulation already established for deriving specification acceptance criteria from lot-release data generally.
CFPS makes this separation harder than it looks. A published methods study found that the initial coefficient of variation in E. coli-based CFPS reactions reached 97.3%, a number driven down substantially once replicate preparation methods were optimized. That number is a warning about what happens when assay noise goes unaddressed: control limits calculated from an unoptimized assay will be inflated by noise that has nothing to do with the reagent lot being tested, and a chart built on those limits will be too wide to catch a real shift when one occurs.
The practical consequence is an order of operations. Assay noise in an uncharacterized assay built into a chart ends up dominating the measurement, masking the reagent's own variability. The finding from the first section pays off directly here: because the chemical components of the reagent mix are the dominant source of real variability, and because those components (concentration, pH, conductivity) can often be measured by direct analytical methods rather than by a functional assay, there is a path to release criteria built on the most direct, least noisy measurement available. A chemical measurement of ATP or magnesium concentration carries its own precision, but it avoids stacking a second layer of biological assay noise on top of the question being asked.
Choosing and constructing the right control charts for reagent lot data
Picking the right chart type is not a stylistic choice. Applying the wrong one to reagent lot data causes the chart to either miss shifts that matter or flag noise that doesn't, and a quality program built on either failure mode stops being trusted by the people who have to act on it. Reagent lot release generates one data point per lot rather than subgroups of replicate measurements within a lot, which rules out the X-bar and R charts built for continuous production with natural subgrouping. The correct structure is an individuals chart paired with a moving-range chart, commonly called an I-MR chart, built specifically for data that arrives one value at a time.
The baseline used to set control limits on that chart matters as much as the chart type itself. A chart built on a contaminated baseline gives a false sense of security precisely when a real problem of similar magnitude occurs again.
Every signal a control chart produces, a point outside three-sigma limits, a run of points sitting on one side of the center line, a steady trend of increases or decreases, calls for a documented investigation, whether or not that investigation turns up a clear root cause. That requirement converts a chart from a monitoring tool into a quality record: the history of investigations, found causes and all, becomes evidence that the process is being watched.
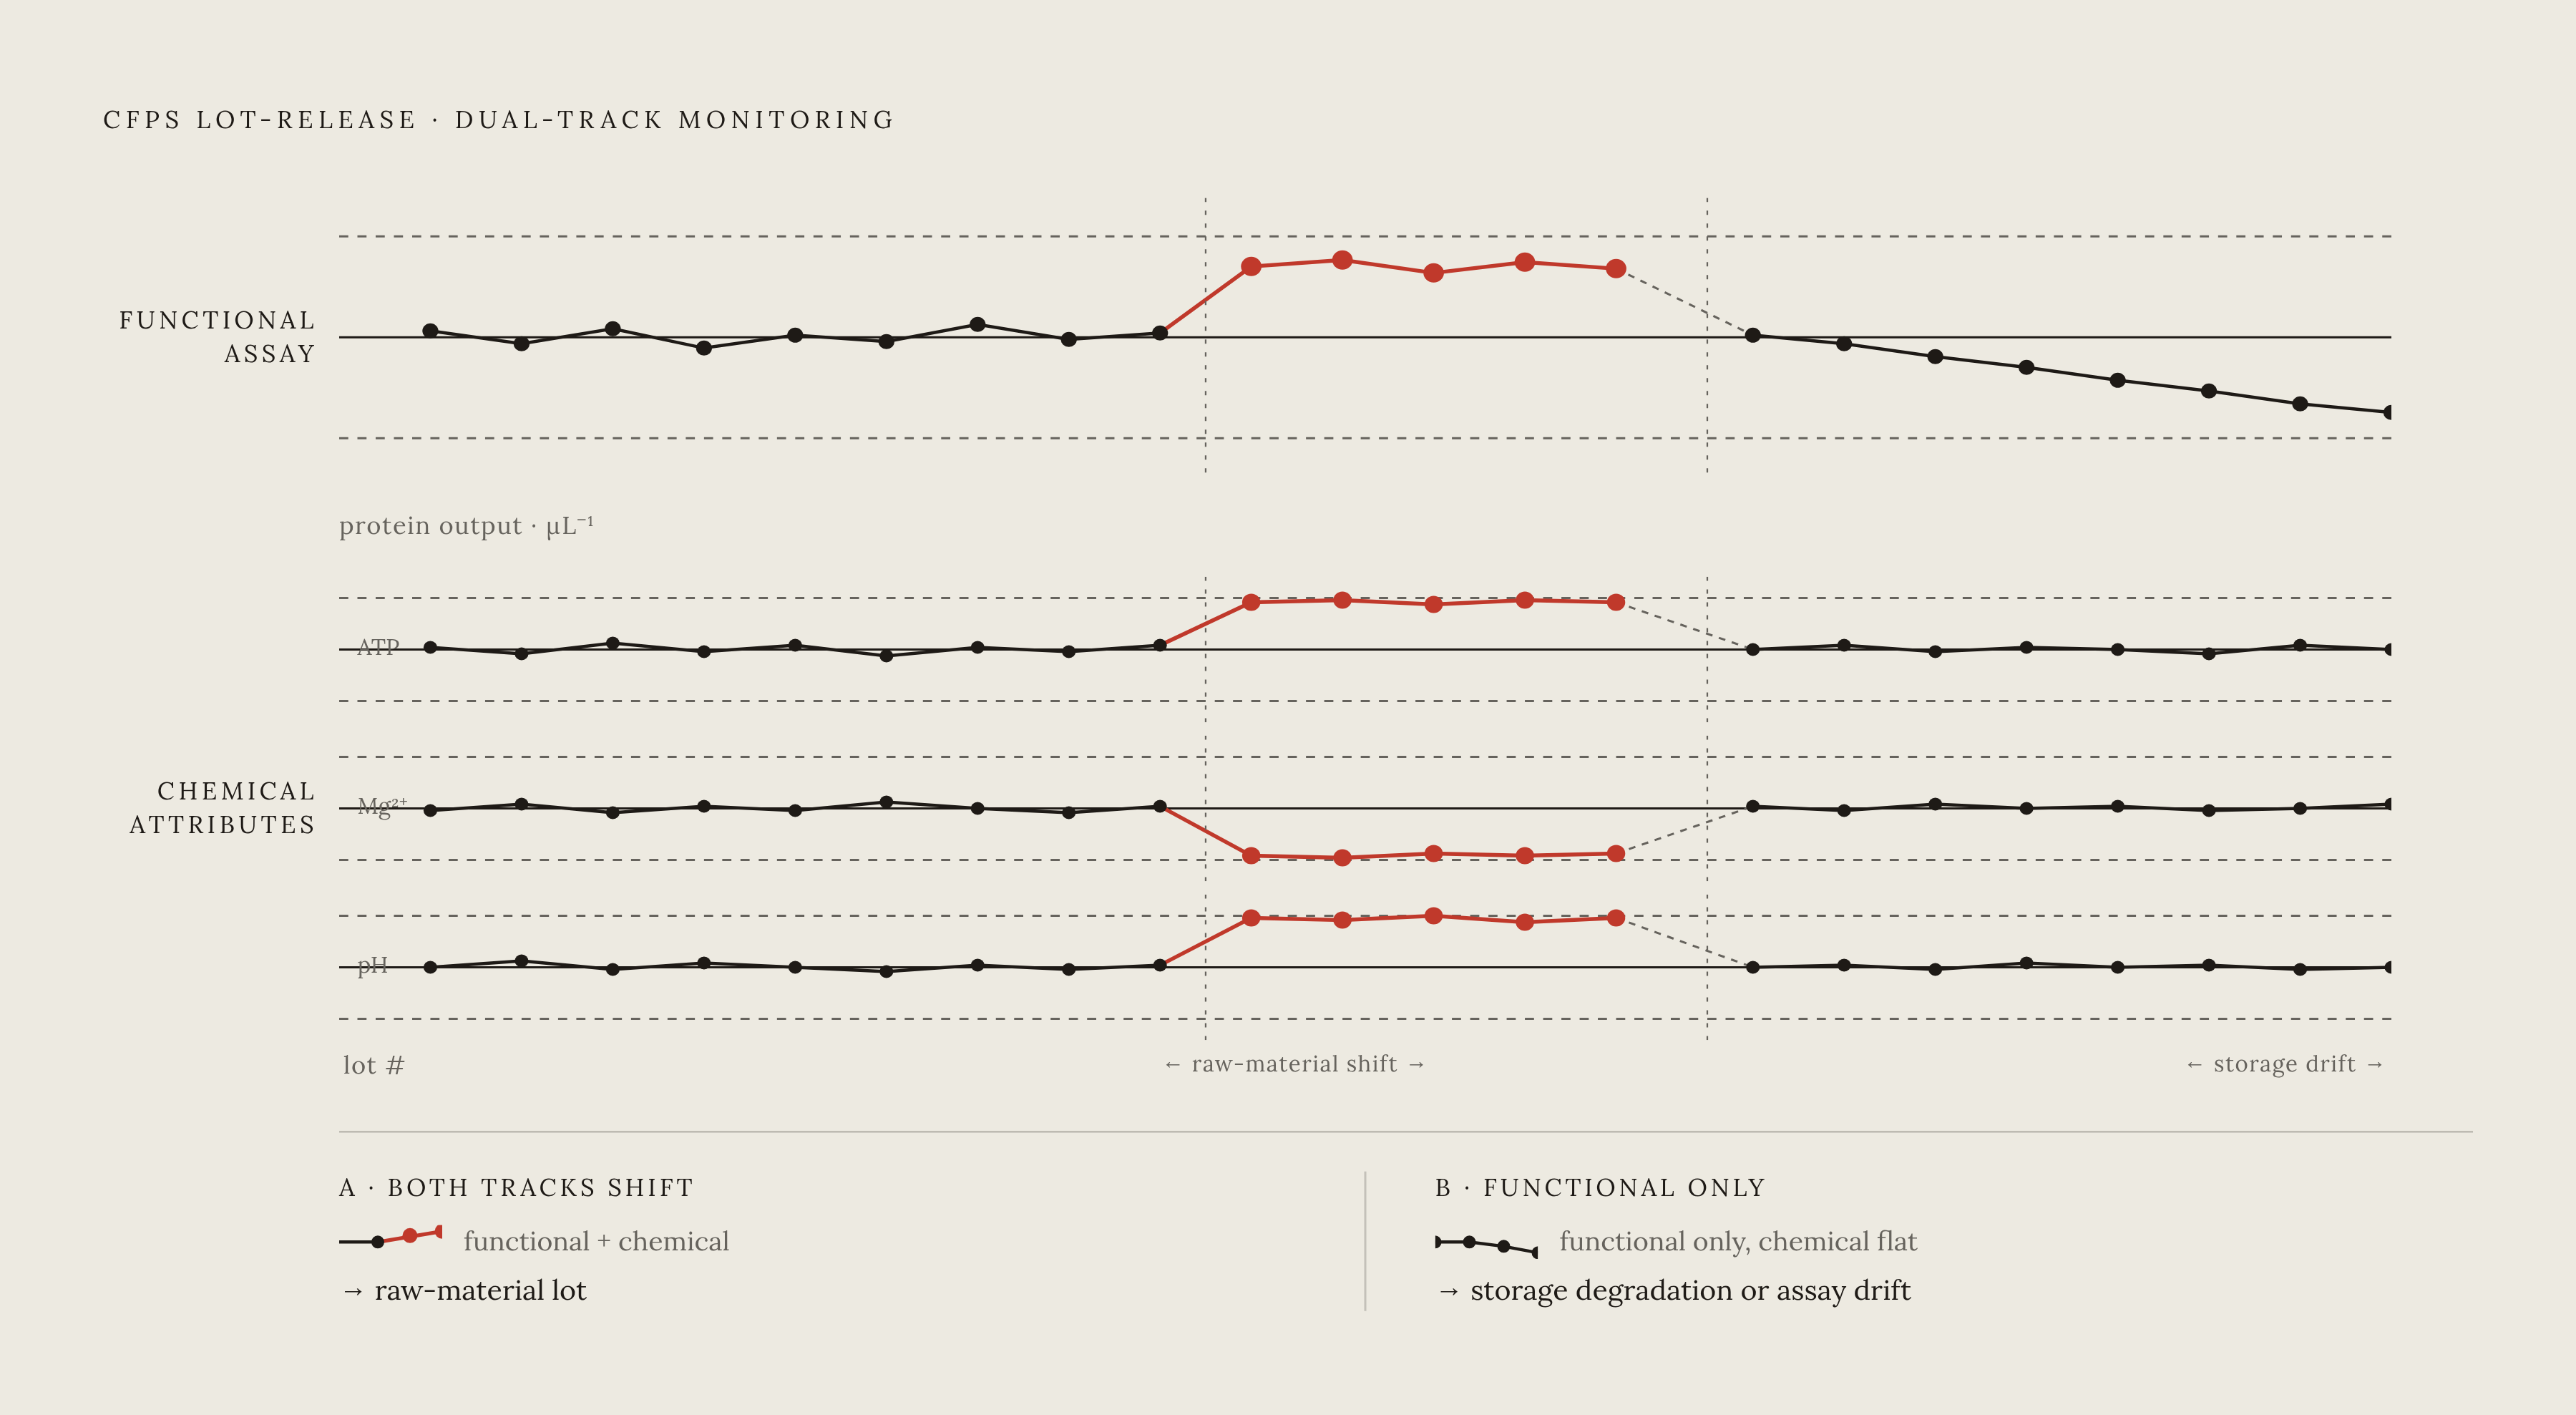
For CFPS reagent lots specifically, two layers of charting work together. One tracks the functional release assay itself, typically reporter protein output per microliter, as the primary signal of whether a lot performs as expected. The second tracks the chemical attributes of the energy-regeneration mix independently, things like ATP concentration, magnesium concentration, and pH, as leading indicators that catch a shift in the chemical mix before it affects the functional result. Reading the two layers together also tells an investigator what kind of problem has occurred: a sudden shift that appears on both the functional chart and a chemical attribute chart at the same time points toward a specific raw-material lot as the cause, while a gradual trend on the functional chart with no matching signal on the chemical charts points toward storage degradation or drift in the assay itself.
Setting release specifications from tolerance intervals rather than arbitrary thresholds
Every lot release decision eventually comes down to a single question: does this lot's result fall inside a range that can be trusted, or not? It answers a specific and useful question: given what's been observed so far, what range should cover most future lots from this same process, with high confidence? That is a stronger and more honest standard than a confidence interval drawn around the mean, because it is built to bound individual future results, not just the average.
Pharmaceutical practice sets specification acceptance criteria this way, calculating tolerance intervals from lot-release data using the same combined lot-to-lot and method variance described earlier, so that a specification reflects the process's actual demonstrated behavior rather than the result of one early development batch. A CFPS reagent program just starting to build its own lot history will see wide tolerance intervals at first, simply because few lots exist yet to estimate variability from. Those intervals should narrow as more lots accumulate, and a written plan for tightening specifications at defined lot-count milestones is how that improvement gets captured on paper rather than left as an informal sense that the process has gotten better.
Cpk connects this tolerance-interval work back to the control charts described earlier. For a CFPS program still early in its lot history, where the number of released lots may be small, Ppk is the more honest number to track, because it's calculated from total observed variation rather than assuming the process has already settled into long-term steady-state behavior, an assumption young reagent programs usually can't support yet.
PAT sensors and real-time monitoring upstream of lot release
Everything described so far treats lot release as a checkpoint: a lot is prepared, measured, and then either released or held based on where its result falls relative to a specification. Process analytical technology moves that checkpoint earlier, by putting in-line sensors, pH probes, conductivity meters, spectroscopic instruments, directly into the preparation process itself. That shift turns lot release from a single pass-or-fail gate at the end into a decision informed by data collected continuously while the lot is being made.
A 2026 analysis of PAT in biopharmaceutical manufacturing describes in-line pH and conductivity sensors monitoring buffer strength and reagent consistency as part of a closed-loop control strategy that reduces batch variability and improves reproducibility during RNA manufacturing. The same logic applies directly to the buffer and reagent-consistency work involved in preparing a CFPS energy mix. For CFPS specifically, the most useful targets for this kind of sensor are the chemical attributes of the energy-regeneration mix, the same components identified earlier as the dominant source of lot-to-lot variability, because they can be measured by direct physical instruments rather than requiring a full functional protein-synthesis assay to evaluate.
PAT data feeds into the SPC structure described throughout this piece in two distinct ways. Used retrospectively, it adds another layer of attribute-level control charts, giving investigators a finer-grained history to read alongside the functional assay results. Used in real time, it does something the end-point release test never could: a sensor reading that crosses a control limit during preparation can trigger a halt or an adjustment before the lot is even finished, catching the defect while it is still forming rather than discovering it afterward in a failed assay. That is the furthest extension of the argument this piece has made from the start: the components most responsible for CFPS reagent variability are also the components most directly measurable, and the earlier in the process that measurement happens, the less a lab has to rely on statistics alone to catch a problem after the fact.